Another week of rewards have been distributed to HIVE authors, and it is time to look, again, in depth at who and what got rewarded, based on word counts, post structure, images, and a number of other bits and pieces. Before I begin with the report, there are some new features I have built into my data set, that enable greater analytical depth.
Whats New since last week?
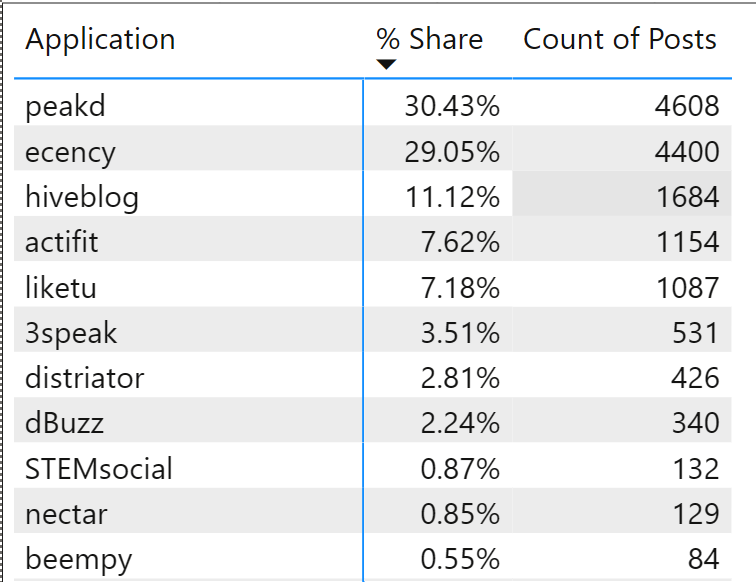
Word count by HIVE interface!
This will allow better comparison between like for like posts, for those who do not see word count as "value" or "effort" put into a post. It also also direct comparison of the trends of content created by users of different interfaces.
Here is how that data was extracted - it is derived from the json_metadata column. Extraction occurs via a custom column.
This is a little more difficult than I first anticipated, as the json_metadata field does not consistently place the "app" value. Therefore, I have had to do some... really quite bad stuff in a Power Query Custom column in order to extract which application was used for posts.
let
    sourceText = [json_metadata],
    appKeyPos = Text.PositionOf(sourceText, """app"":"),

    result =
        if appKeyPos <> -1 then
            let

                afterApp = Text.Middle(sourceText, appKeyPos + 6),

                trimmed = Text.TrimStart(afterApp),

                firstQuote = Text.PositionOf(trimmed, """"),

                afterQuote = Text.Middle(trimmed, firstQuote + 1),

                secondQuote = Text.PositionOf(afterQuote, """"),

                appValue = Text.Start(afterQuote, secondQuote)
            in
                appValue
        else null
in
    result
Since I am using Power Query, this is the quickest way I could fathom to get this feature up and running. I may improve the methodology in the future, but at least this gives me a base line.
This also gives me the ability now, to exclude certain applications from the reporting, which should get closer to the "true" posts written by authors, as opposed to by a curation service which uses automation such as beem or other libraries that interact with the HIVE chain.
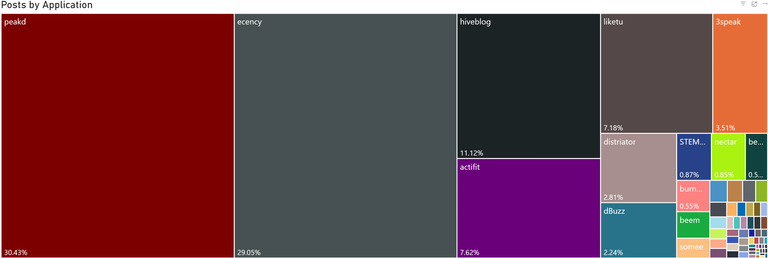
The visuals below are for just the most recent week of data, as a proof of concept.
Here is some more, polished detail:
Reply Depth, and Average Replies
I've added data points for reply depth (how many replies a top level post generates) and average and median replies to posts.
Week on Week Data
Now that I have a 2nd week of data, I can compare trends in posting week on week. Is there really a dearth of content, or are we just imagining it?
Seems like there is about the same number of posts. Posts seem to be getting slightly longer, which I think is great, but not everyone agrees, as not all posts are long stories, or long reports.
Anyway, onto the usual reporting:
The secondweek of July is now over, and I've refined the process even further (As evidenced above!)
I am still keen to hear from all of you what you think of this data, and how it can be further improved in the future.
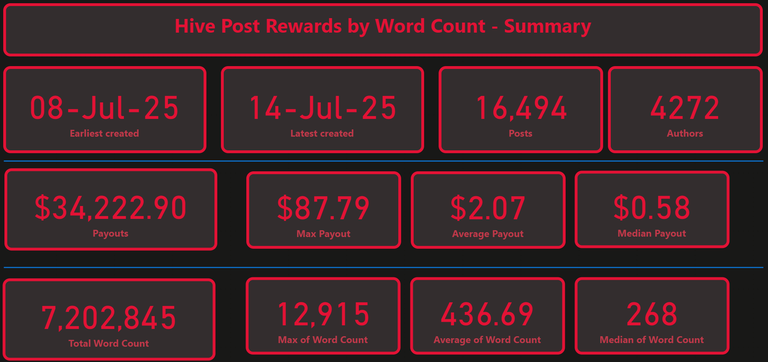
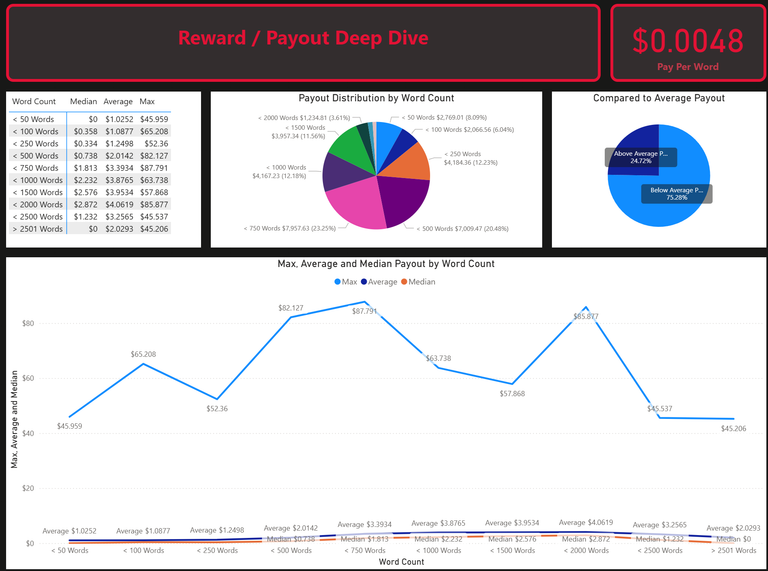
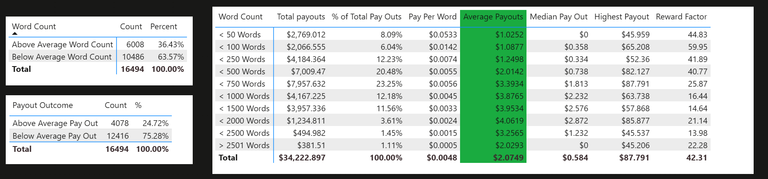
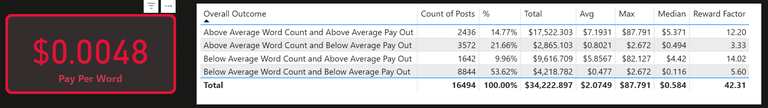
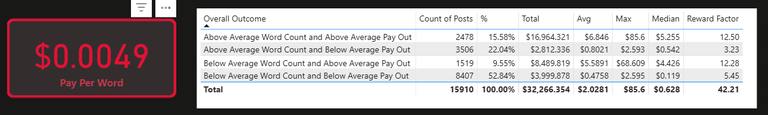
For the second week of July, there was $34,222.9 in rewards distributed, compared to $32,266.35 for the prior week. The average payout increased by four cents. The max increased from $85.60 $87.79. The median was reduced from $0.63 to $0.58.
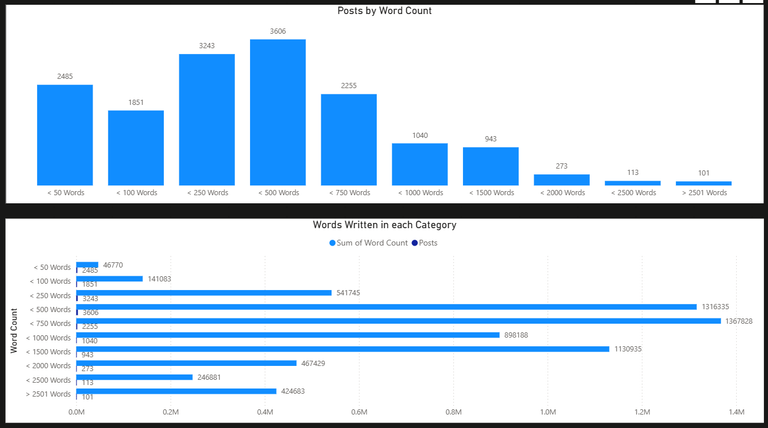
The highest word count was 12,915, a little bit longer than last week, the average was up to 436, and the median decreased by three, from 271 to 268.
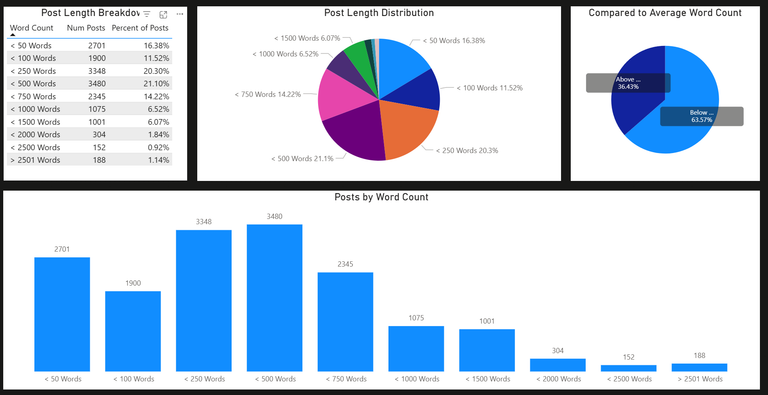
The overall trend of shorter posts being the more dominant on the platform continued, with only 36.43% of posts being longer than average.
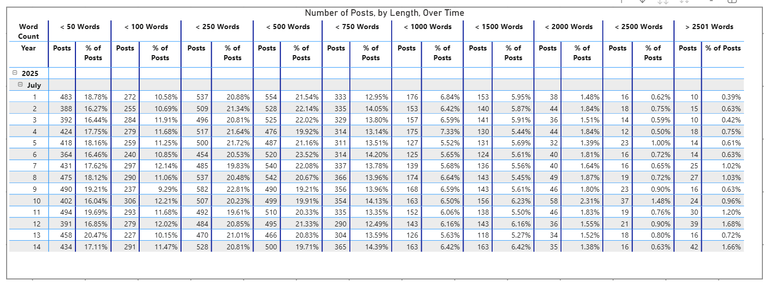
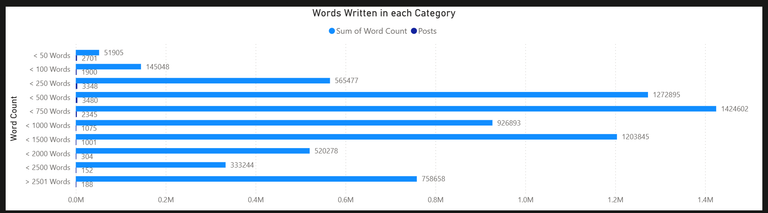
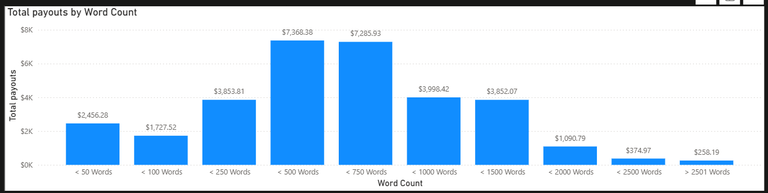
7.2 million words were published in total on HIVE for the period, and here is the distribution from last week, which you can compare to the above for this week.
While there were more of the longest types of posts, in the 2000+ word category, there were less in the <1500 and <1000 word categories.
Last Week:
Back to this week:
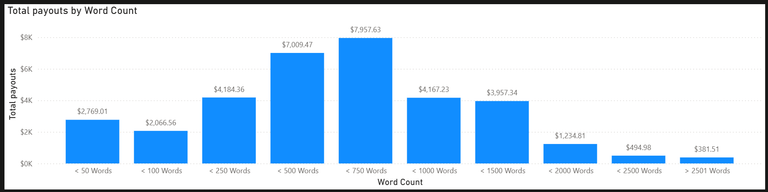
Pay per word was about the same since the last set of data was imported, and the majority of the payouts went to posts under 750 words. Sadly, average payouts to shorter posts increased, but payouts were up across the board, seems like there was a little more in the reward pool.
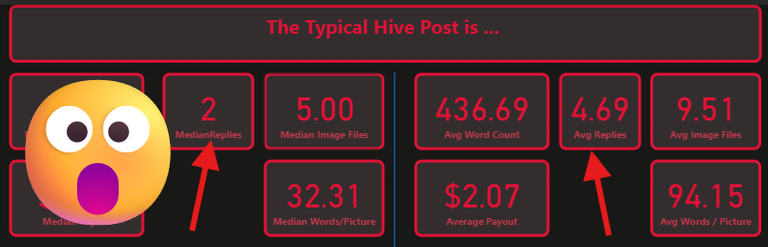
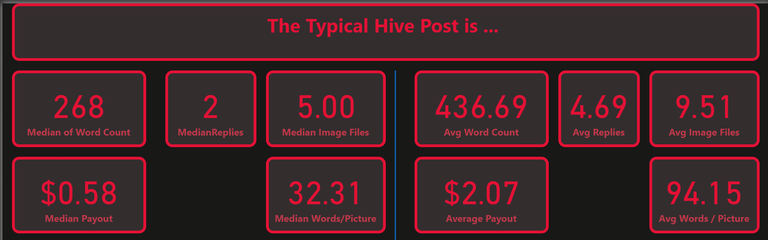
What about the typical post on HIVE? What does that look like? Well, thankfully, here's some stats - this week with some new data points, average replies!
Posts got slightly longer, included more pictures. Median pay was down, average pay was up.
It will be interesting to see how replies change over time.
There still isn't much difference between the median and average post, other than the fact that there's significantly more words in the average, and a few more pictures.
How does total, aggregated payout look, compared to the word count? A little bit like the distribution of the posts, it seems, with a steep falloff for longer posts.
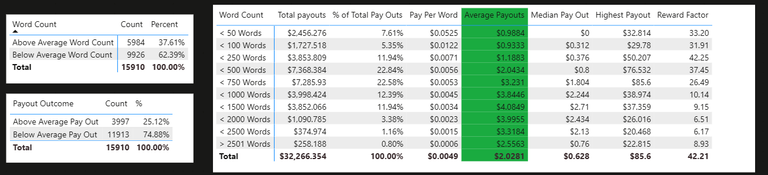
Pleasingly, longer posts got a much larger percentage of the rewards than when compared to the week prior, while posts under 500 words appeared to "pay for this".
This Week
Last Week
How about when we consider a few more variables, and look at the reward factor? That is to say, the highest payout in a word count group divided by the average? Are these posts still 40x (overall) more valuable than the average post on HIVE?
This Week
Last Week
Moving On
Only 14.77% of all posts published on Hive were above average word count and above average pay out. 9.96% were below average word count, and above average payout. There is room for awards to be allocated by curators to those appearing in the above average word count and below average payout category. There's ~$7k of awards allocated to shorter posts, while longer posts go unrewarded.
There is too high of a reward factor on posts in the category of "below average word count and above average pay out". Again, that's max payout divided by average, presented as a number. In fact, it grew.
This Week
Last Week
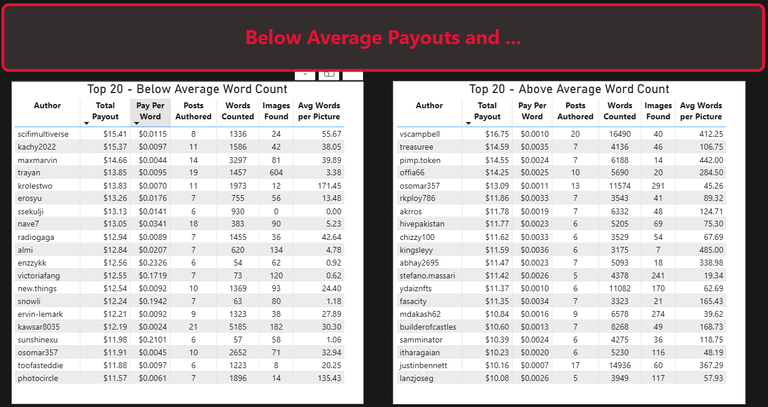
What about when we look at authors on an individual basis, for the period? (Or at least the top 20 for each category?
Last Week
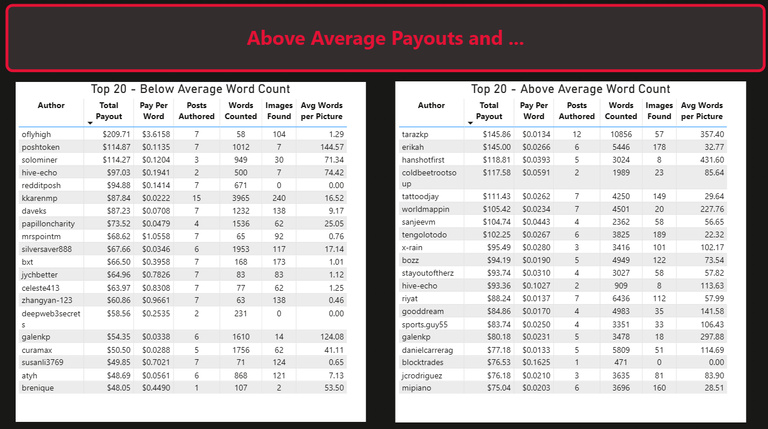
This Week
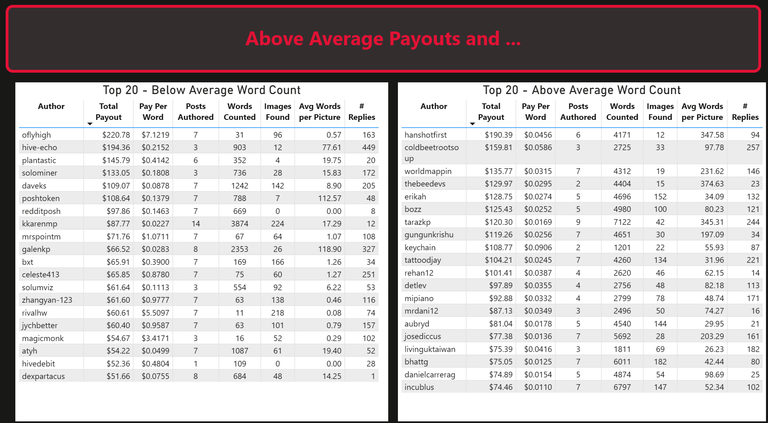
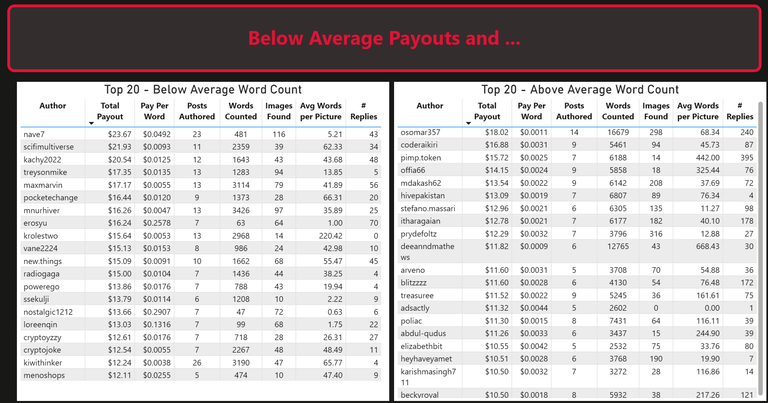
I have added engagement, by measure of total number of replies to an author's top level posts here. I am curious as to the range of comments received by authors in these categories. There's a wide variation in the engagement each author gets for their rewards, regardless of their word count.
The same authors tend to appear in the lists, week on week. They're consistent and persistent.
What about those potentially "emerging" authors, with Below Average payouts?
Last Week
This Week
The below average payout group seems to have some different names, apart from some of the token projects that seem to post daily round ups.
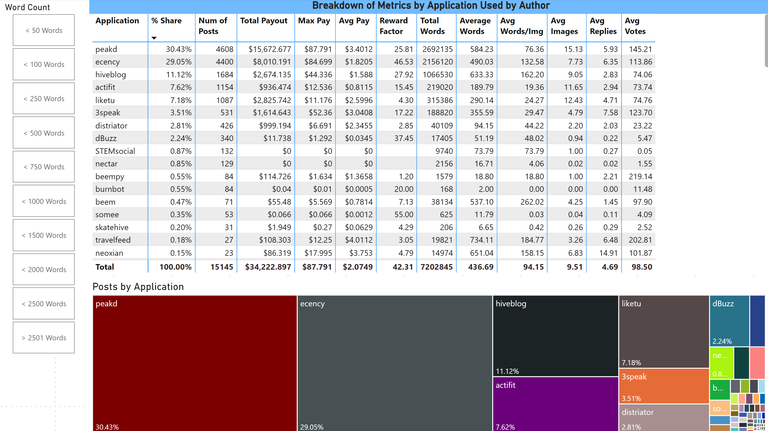
Finally, I have put together a view of the key metrics I'm looking into for this data set into a slice by community, sorted by total payouts.
Last Week
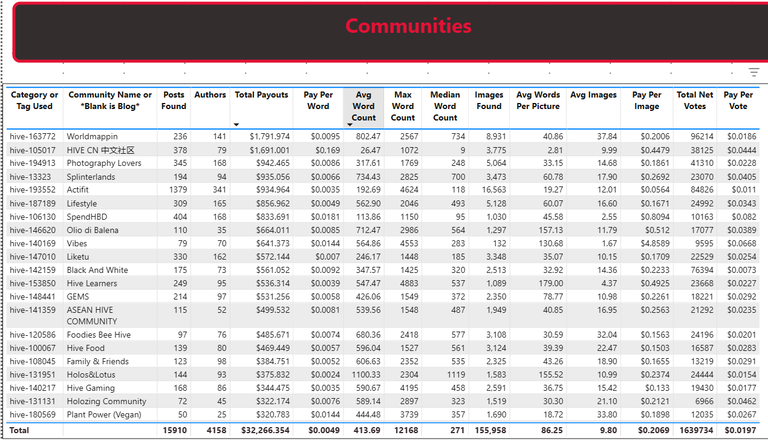
This Week
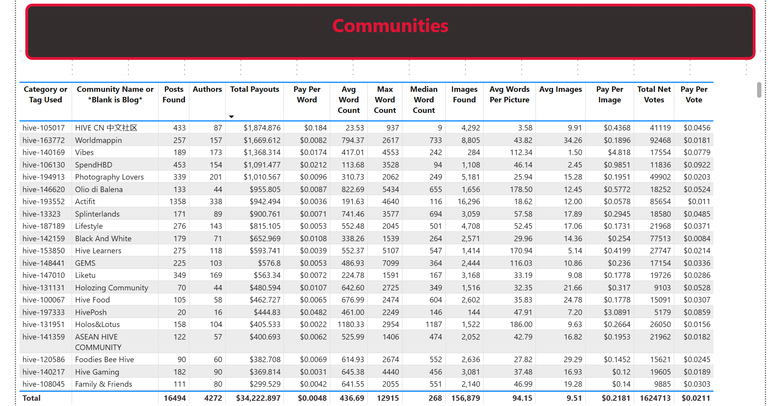
HIVE CN took the crown this week, and Spend HBD was down in volume by about $200. Wordmappin and Photography Lovers remained strong, and Splinterlands moved up a little.
Who the fuck swears the most in their posts on HIVE? (Not comments, just posts!)
The only words, as an Aussie, that I consider swearing are "shit", "fuck", "cunt" (or variations thereof, so this captures "fucker", "fuckhead", "motherfucker", "shithead", etc
I think to no one's grand surprise, @galenkp continues to be the custodian of Hive's swear jar. Do try to be nicer to them, outside world. :)
Last Week:
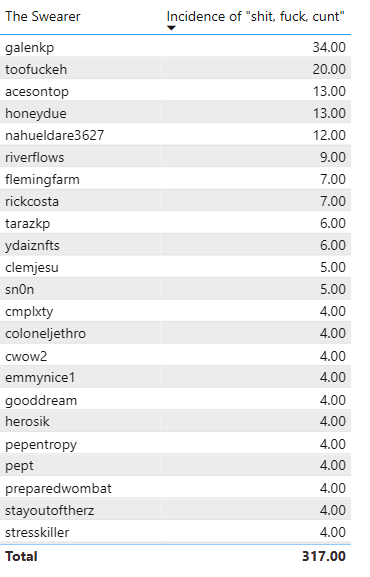
This Week:
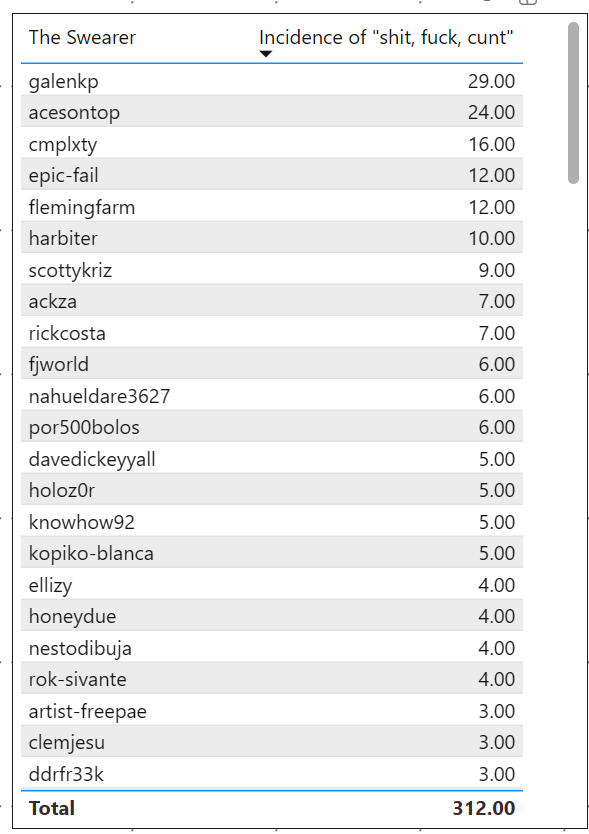
Less money in the swear jar this week, @galenkp, but you're still on top. Hive was 5 less words sweary this week, so well done everyone on watching the potty mouth in your posts! :P (Sarcasm) I will probably continue to appear in this list on account of this fucking post quoting the swear words that I am looking for.
Thanks for taking a look at the data. I'm still keen to get more ideas from you all on how this can be improved for future iterations and hope you enjoyed the new features, or whatever other metrics I might be able to extract.
That potty mouth Galen 🤣🤣
Yeah, they say swearing shows a lack of education. I must be an uneducated dumb fuck huh?
I've always thought that funny when some scammer or similar dickpiece accused me of being of low iq because I swear at them and call them names. It takes a bit of mental pizzazz to swear well!
Yeah, that old chestnut:
"You're stupid because you have to resort to swearing."
Yep, that's right cunt, I fuck do.
Wankers. So many wankers out there.
Only utter wankers can be as wankery as they can 😀😀
I see it as the opposite, if you can't swear with fucking aplomb then you aren't as bright as you think!!!
Well said, titanically said. And see? I didn't have to fucken swear once in this whole comment.
Fuckin yeah!! 😀😀
He's true to himself, at least :) He has a good vocabulary. It isn't distasteful swearing. It is elegant use of the language, as though he were a ballerina twirling obscenities like a whirling dervish in some sort of demented double metaphor.
That is a fine way to put it!
Ballet-swearing...yep, that's what I go for.
It really does bring out your eyes
I'm not surprised. 👀
Lots of data here! I found this communities data most useful:

One thing that would be easy to add to this table would be pay per post. It is interesting to note that some communities have huge number of posts 1358 like Actifit but total payouts are lower than small communities with only 44 authors and 133 posts Olio di Balena.
Would be interesting to rank these top communities by pay per post effectively showing where posts are valued the most...
Your reply is upvoted by @topcomment; a manual curation service that rewards meaningful and engaging comments.
More Info - Support us! - Reports - Discord Channel
That is easy to do! Average pay and median pay per post coming for the next edition!
You're good at statistics. Bravo!👏
Just as you do with the number of words per post, I think it's also important to know how many photographs per post.
Could photography communities, or others that thrive on photography (worldmapping, for example), be tracked in the same way? Could the tools you use generate these statistics?
Posts with 1 photograph.
Posts with 1 to 5 photographs.
Posts with 5 to 10 photographs.
Posts with more than 10 photographs.
That's if you see any interest. It would be interesting for me, because I never know if I'm posting too many or too few photographs 🤔
Thanks a lot 🤝
P.S. There's a very interesting popular reflection in Portugal about swear words: "It's better to say them than to think them."
In northern Portugal, the use of swear words is perfectly normal and established. No one takes offense. People are not judged by the stupid things they say, but by the stupid things they do.
Yes, absolutely, I can bucket images the same way. :)
I am already counting the number of images per post, and when we examine that in the context of the communities such as photography lovers, or world mapping, or others that are image heavy, we can compare those posts like for like.
I can even exclude photography communities from the overarching payouts here, and examine word counts as a seperate data set from those.
There is some data on that (briefly) in one of images in this report.
You can see the avg images column. World Mapping posts have an average of 34, while photography lovers has an average of 15.
Amusingly, World Mapping has a higher than the average word count :)
Photography lovers is below it, people in that community (myself included, when I publish my photography there!) tend to like to have the images speak for themselves.
Only by comparing this data on a community by community level will it truly have the right level of granularity to compare posts against their peers.
I am but a single man, and don't have the ability to do that for every community, but I would be prepared to do it for Photography Lovers - its a large community, it has subject matter I am familiar with (I studied Photography at University!) so it might be an ideal target for my overlapping areas of knowledge.
Meanwhile, In Australia, where I live, people don't care about swearing too much either :) I have no problem with it! :)
I really do appreciate your feedback, and I will definitely incorporate the "buckets of photos" for next week's data set, which should become available in about 7 days once the current set of posts have had their rewards determined.
(Not that rewards matter - but they are interesting to look at!)
Wow, then I've come to the right place.
A while ago, he left me a comment that deserved my attention because it could only be made by someone who studied photography. That's clear.🧑🎓📸
Yes, rewards aren't the most important thing. But it's important to reflect.
I've compiled all the HIVE photography communities. If it's useful to you, I can send it to you via DM on Discord. This will make your research easier.
I'm very grateful for the attention my comment received.🤝
Please send me the list, it will definitely save me a lot of time :)
Same username on discord, same display pic. :)
Yes, I will. Maybe in the middle of the afternoon? I'm traveling and have the list on my PC, not my smartphone.
No rush, I will be in bed soon, on the other side of the planet. :D I can do a deep(er) dive focusing on photographic communities in the coming days, using the same 14 days of data.
Oops, I forgot the time zone. Now it's time for the kangaroos to go to sleep.🦘
(Note: I'm not calling you a kangaroo.)😀 It's a joke 😂
This is quite a data dump :) Nice!
Will need to go throug it a few times.
On a first look, there is data for posts by aplication, there is a breakdown of all the posts by word count, but there is no breakdown on word count by app... if I can see right?
You can get data for character numbers from the comments table, column body lenght... and break it down by app, you can then divide the number of characters with some average character per word and get a proxy for the word by app...
I have engineered that as a column in my PowerBI DAX. I'm just counting the spaces in the text to get the wordcount, plus one.
I have that as a slicer on the left hand side of this image:
It shows the averages per interface, but I haven't yet got a measure to count num posts per word count group. I ran out of time to do that for today's post but I can definitely elaborate on it further.
Word count by interface! 🤯 Great to see deeper analytics; keep up the awesome work. 🐎📊
Cheers! Appreciate you stopping by!
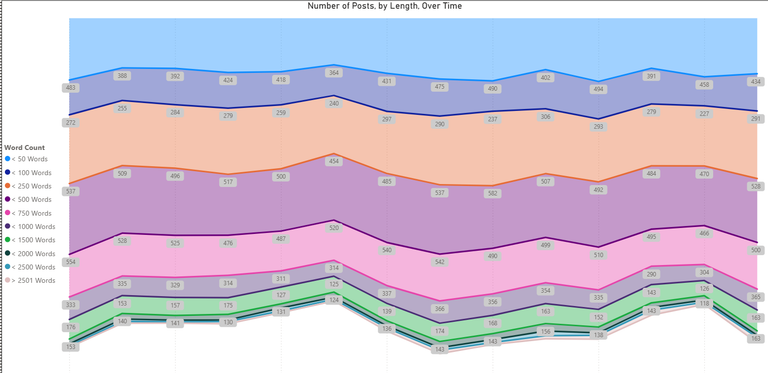
wouldn't it be more understandable if the graph had the data on the other way around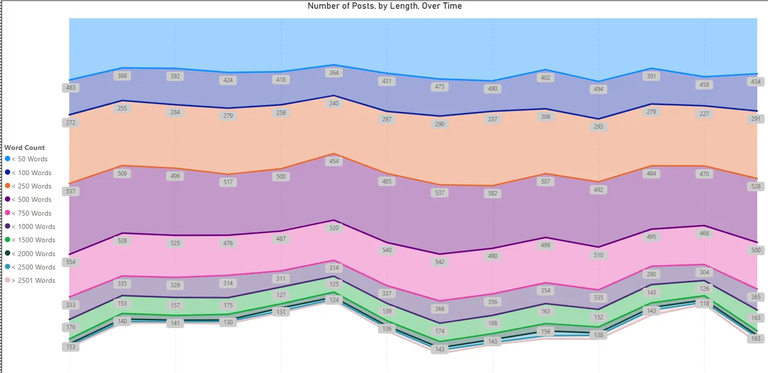
like "small posts at the bottom"
I had it like that in my software initially, but I wanted the direction of the legend to match :P
Also, I am Australian so something has to be upside down!
If your are Australian, it make sense : P
(daily,meme is my side account, i forgot to switch before commenting haha)
I'm not going to show you my passport, but you'll have to take my word for it ;)
As a new user who prefers medium-long form content, I share your sentiment. Thank you for giving me a list of accounts and communities to follow and support. Unfortunately there there isn't any objective way to quantify quality, but I will take Earnings/word as my starting point and filter from there.
You're welcome! I am very data driven as an individual, in case the post didn't show that!
Rewards aren't necessarily a measure of quality at all, because people with hive power determine the rewards, and their vote is what they value. They determine that, but on the whole, you would think that the property of quality would emerge across the user base of hive.
There are several issues to consider: distribution of hive power, people's motives and actions for voting on content, and the variable that every hive account has its own motivations, goals, and purpose.
Jesus tapdancing Christ we need to watch our fuckin' mouths around here.
Only if you want to lip read, or look at talking head 3speak videos
Excellent round-up, some interesting stats for sure! It would be interesting to compare the statistics to a quality measure as well. More words don't always warrant more rewards, especially for community accounts or those with big footnotes that inflate their word count without adding any real value.
I might need to add some profanity to a few posts this week, see if I can get myself onto the wall of fame!
I would love it if you used the #slothbuzz tag on these posts (And all your posts tbh) so I don't miss them in the future.
I have already started thinking about this. I know there are many authors who have 100-300 "word" signatures made up of pictures, badges, and a whole bunch of other content that doesn't necessarily add value to the post, that this sort of programmatic analysis cannot reasonably exclude - just like the amount of video length that is added onto something on YouTube through baked in sponsor spots or people pan handling for like and subscribe, etc.
Well, you know the benchmark now at least.
So you don't miss my posts, do I need to get more click-baity with my headlines and opening paragraphs? :D
What else can I do to increase click-ability? I honestly don't ascribe much value to the tags, as I can't remember the last time I personally used tags to discover content on HIVE.
For people that I absolutely don't want to miss, I favourite them, that way there's a menu on my right hand side in peakd, and I can click the favourites feed to see content only from them, separating it fromm the rest of the people I follow.