Here are a few ways to do just that:
1. Know Your Key Levels
In order to achieve asymmetric returns, you must first identify key support and resistance levels.
Without these areas, you won’t be able to determine your stop loss placement or profit target.
Take the chart below as an example.
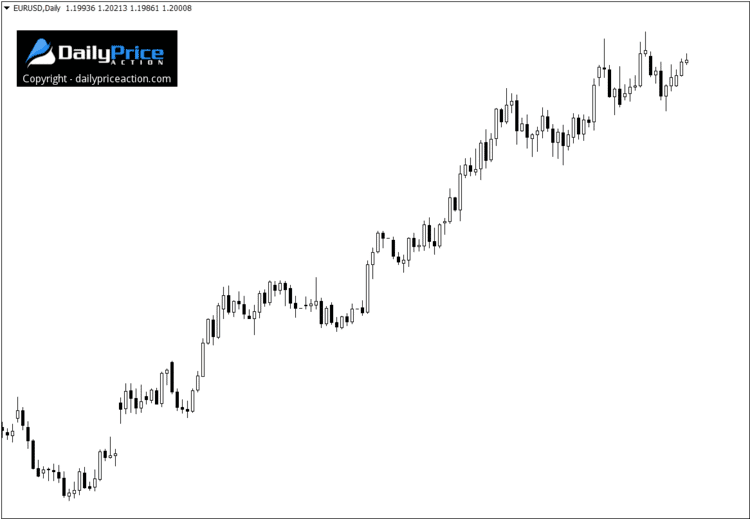
A blank chart doesn’t do us much good. Not only are we unable to identify profitable opportunities, but we also can’t determine if the reward is worth the risk.
Once we plot our key horizontal levels, everything becomes clear. If we know the distance between each range, we can calculate the risk to reward for any setup that comes along.
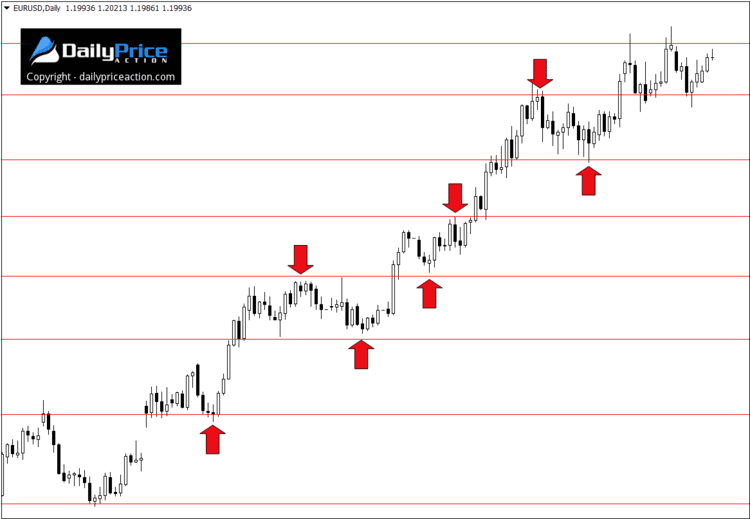
These key areas are like the foundation of a house. They offer a stable starting point in terms of where to focus your attention, as well as where to place your orders.
You wouldn’t start building a house without a foundation, right?
Apart from learning to control your emotions, knowing how to draw support and resistance correctly is perhaps the most desirable trait of any trader. In fact, once you know how to plot these areas, everything else becomes rather effortless.
Think of it this way: if a bullish pin bar forms at critical support, the only way to know if a favorable profit to loss ratio is possible is to know the location of the next resistance level.
If the pin bar requires a 50 pip stop loss and the next resistance level is 100 pips away, you may have something worthwhile.
On the other hand, if there’s 50 pips or less between the candlestick pattern on the next level, you should think twice about risking your capital.
See what I mean? Once support and resistance are in place, it’s simply a matter of asking yourself whether an asymmetric return is possible
2. Evaluate Momentum
Want to know which side of the market the big banks and funds are on?
Sure you do. Luckily, determining where these institutions are positioned at any point in time is quite simple.
All you need to do is evaluate the momentum. If the trend is pointing higher, it means most of the big players are buying the market.
Conversely, if the trend is heading lower, it means the banks and funds are likely selling the market.
I know what you’re thinking. If it were that easy, we would all be on the “right” side of the market.
But I never said it was easy. I said it’s simple. Those are two very different things.
However, trend analysis doesn’t need to be difficult. It’s really just a matter of figuring out whether the market is creating higher highs and lows, or lower highs and lows.
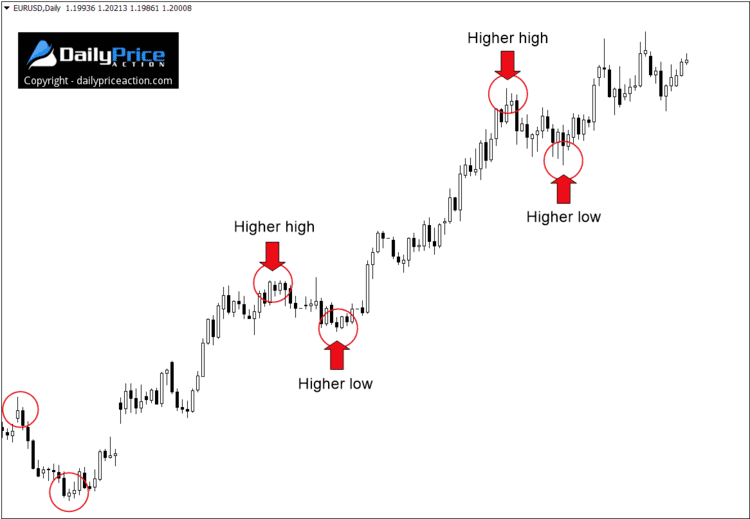
All I did in the chart above was plot the swing lows and highs. As soon as I see this, it becomes obvious which side of the market I should be on.
We can even take it one step further and plot an ascending channel.
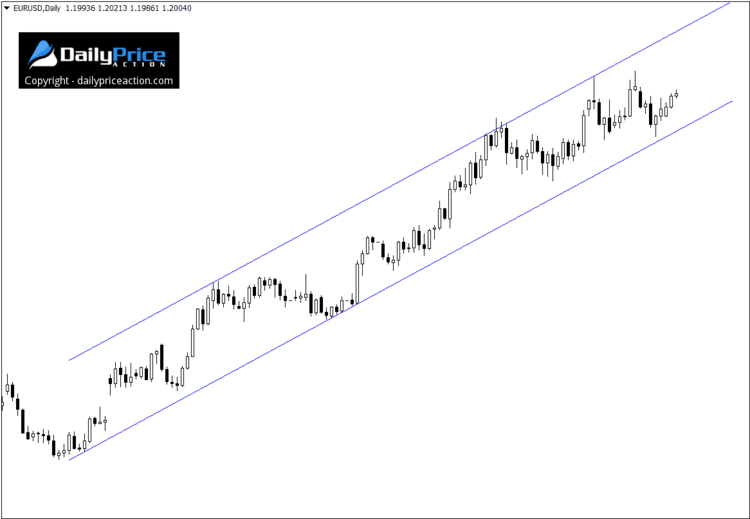
Want to know when you should stop buying the EURUSD?
A close below that channel support is a good place to start. If the pair breaks that, there is a good chance the market will rotate lower.
That’s all there is to it.
Once you know where the big boys are positioned, you can watch for opportunities in the same direction. By trading along with the momentum, your odds of achieving asymmetric profits such as 2R or 3R increases exponentially.
3. Use Measured Objectives
This is my favorite of the three. Measured objectives are perhaps one of the least used tactics in the world of trading.
Most traders have heard of them, but few actually use them to their full advantage.
Put simply, measured objectives are a way to determine a market’s final target following the confirmation of a particular pattern.
I know that may sound confusing but it’s really very simple.
For instance, there is only one way to determine the measured objective for a head and shoulders pattern. You measure from the neckline to the highest point of the head.
Here’s how it looks:

Notice how we first measured the distance from the neckline to the head. Once we have that measurement, we simply measure the same distance starting from the neckline to a lower point in the market.
We can find a similar objective on a pattern such as the broadening wedge.
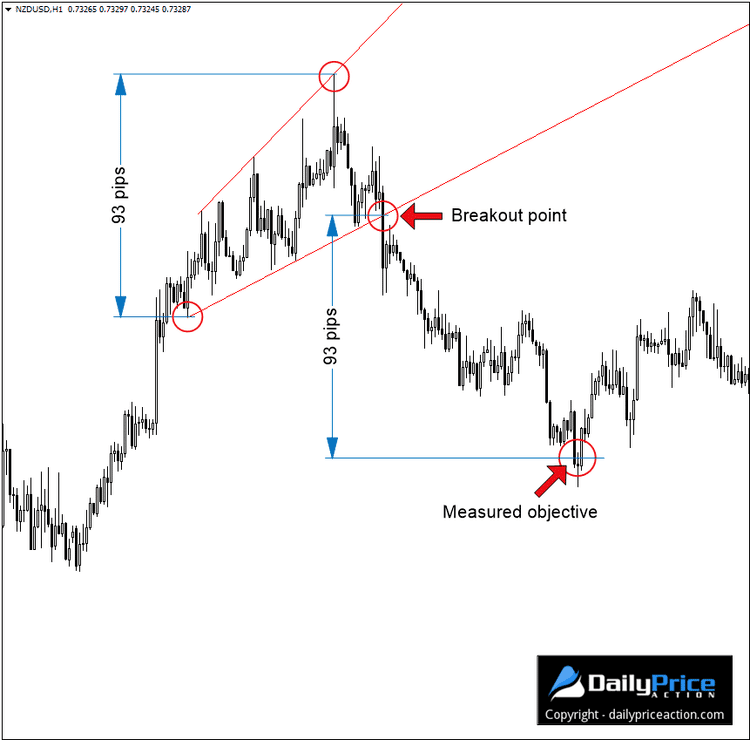
Notice how in this case, we measure the height of the broadening wedge and then use that same distance to identify a final target.
I won’t go into too much detail, as I have already written a lesson on measured objectives. See the links above.
However, you can see how objectives like these can help immensely when determining a final target.
For instance, the head and shoulders pattern on the EURCAD in the chart above had a 620 pip target.
Even the broadening wedge on the NZDUSD 1-hour chart above had a 93 pip objective. The minor swing high that formed before the breakdown was about 20 pips away.
If we divide 20 into 93 we get 4.65. That’s a 4.65R profit in a matter of just a few days.
See how you can use these measured objectives to achieve a favorable Forex risk to reward ratio?
You won’t find price patterns like that often. That’s okay because when you know how to achieve asymmetric returns, you only need one per month to make considerable money.
4. Always Determine Exit Points in Advance
This one is non-negotiable. While you may be able to get away with not using a measured objective, you can’t ignore the importance of defining exit points beforehand.
You can’t calculate risk accurately without knowing exactly where you intend to exit the market. That goes for your stop loss and your profit target.
Without knowing these levels, how can you determine your R-multiple?
You can’t. Yet this is what many Forex traders do, and it’s one of the leading causes of emotional decision-making.
To calculate your R-multiple, you must first define your risk. Without it, you’ll have no idea what 1R represents.
So before placing your next trade, make sure you have defined two exit points—one for where you will exit for a loss and the other is your profit target.
Start with the placement of the stop loss and then use the methods we just discussed to determine if an asymmetric risk to reward is possible.
If so, further consideration is warranted. If not, it may be best to stay on the sideline.
Final Words
One reason many traders are against the idea of using an asymmetric risk to reward ratio is because it’s difficult to determine whether a market will reach its target.
However, you never know what will happen next in any market. There are far too many variables to think you can predict what’s next with absolute certainty.
That isn’t your job. Instead, a trader’s job is to determine what is likely. That’s all.
By using the methods we just discussed, it is possible to use a favorable profit to loss ratio and still have a realistic expectation of a positive result.
Just remember to draw your key levels, evaluate momentum and use measured objectives whenever possible.
Last but not least, always identify your exit points before entering the market. This will allow you to determine whether or not the setup is asymmetric and will also help to reduce emotional decision-making.
Your Turn
What do you think? Will you begin using a minimum risk to reward ratio when scanning for Forex setup?
Leave a comment or ask your question below and I’ll get back to you shortly.